Page 12 - Annual Research Report AY 2019-20
P. 12

R E S E A R C H   B U D G E T


        T O T A L :   1 0 3 , 3 0 0   R . O .


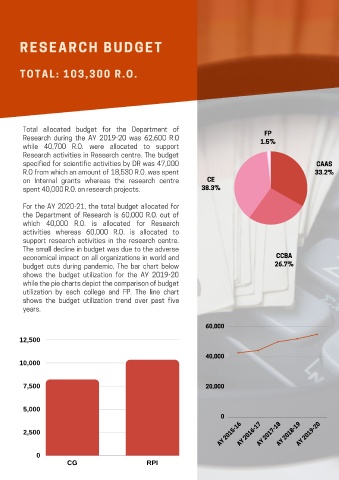
         Total   allocated   budget   for   the   Department   of
                                                                                              FP
         Research   during   the   AY   2019-20   was   62,600   R.O
                                                                                            1.5%
         while   40,700   R.O.   were   allocated   to   support
         Research   activities   in   Research   centre.   The   budget
         specified   for   scientific   activities   by   DR   was   47,000
                                                                                                                CAAS
         R.O  from  which  an  amount  of  18,530  R.O.  was  spent                                             33.2%
                                                                          CE
         on   Internal   grants   whereas   the   research   centre
                                                                        38.3%
         spent 40,000 R.O. on research projects.

         For   the   AY   2020-21,   the   total   budget   allocated   for
         the   Department   of   Research   is   60,000   R.O.   out   of
         which   40,000    R.O.   is   allocated   for   Research
         activities   whereas   60,000   R.O.   is   allocated   to
         support   research   activities   in   the   research   centre.
         The  small  decline  in  budget  was  due  to  the  adverse
                                                                                                  CCBA
         economical   impact   on   all   organizations   in   world   and
                                                                                                 26.7%
         budget   cuts   during   pandemic.   The   bar   chart   below
         shows   the   budget   utilization   for   the   AY   2019-20
         while the pie charts depict the comparison of budget
         utilization   by   each   college   and   FP.   The   line   chart
         shows   the   budget   utilization   trend   over   past   five
         years.


                                                                         60,000
        12,500


                                                                         40,000
        10,000


         7,500                                                           20,000


         5,000
                                                                               0
                                                                              AY 2015-16 AY 2016-17 AY 2017-18 AY 2018-19 AY 2019-20
         2,500


              0
                         CG                          RPI
   7   8   9   10   11   12   13   14   15   16   17